Commodities>Metals & Mining>Metals & Minerals Trading>Trading - Metals
₹74.57
0.55 (0.73%)
High VOLATILITY
As on 12 Jun 2026
Price History
Market Cap
The total value of all a company's shares of stock. It's a quick way to gauge a company's size and value.
₹515 Cr
SMALL CAP
P/E Ratio
Price-to-Earnings ratio. It shows how much you pay for ₹1 of the company's earnings. A lower P/E might mean it's undervalued, but it varies by industry.
31.5
Industry
The specific business sector the company operates in. Useful for comparing with similar companies.
Trading - Metals
52-Week Range
The highest and lowest price at which the stock has traded in the last year (52 weeks). It helps show how volatile the stock is and where it is currently priced relative to its recent history.
52W Low₹45.1+65.3%
52W High₹88.85-16.1%
Current Price
₹74.57
Circuit Limits (20%)
The maximum allowed price movement (up or down) in a single trading day to prevent excessive volatility. If the stock hits these limits, trading may be temporarily halted.
Lower Circuit₹59.66
Upper Circuit₹89.48
Reference Price
₹74.57
Investment Checklist
Triple Bottom on 1D (BREAKOUT CONFIRMED) — target ₹67.2
Triple Bottom on 1D (BREAKOUT CONFIRMED) — target ₹63.7
Trend: Price above all key MAs — strong uptrend
Volume divergence: Bearish (price up, volume down)
RSI at 75.3 — overbought, pullback risk
Technical Analysis
Technical Analysis
Analysis from 2026-06-12
Confidence
79%
Trend
BULLISH
BULLISH
Price above all key MAs — strong uptrend
EMA20
66.8
EMA50
60.42
EMA200
61.71
Price Action
MIXED
NEUTRAL
Higher Highs4
Higher Lows5
Lower Highs5
Lower Lows4
Support & Resistance Levels
Resistance (Above)
₹75.21
₹80.12
₹82.90
Support (Below)
₹73.25
₹71.50
₹70.50
₹68.14
₹66.10
Volume Analysis
TrendDECREASING
Change-16.40%
Unusual VolumeNo
Divergence Detected
Bearish (price up, volume down)
Stop Loss Levels
Fixed Risk
1% Risk₹73.82
3% Risk₹72.33
5% Risk₹70.84
7% Risk (Custom)
₹69.35Technical Levels
1x ATR (Volatility)₹70.71
2x ATR (Swing)₹66.85
3x ATR (Trend)₹62.99
Immediate Support₹73.25
Moving Averages
EMA 9 (Short-term)₹72.11
EMA 20 (Medium-term)₹66.80
EMA 50 (Trend)₹60.42
EMA 200 (Long-term)₹61.71
Financials
Financial Analysis
| Metric | Dec '24 | Mar '25 | Jun '25 | Sep '25 |
|---|---|---|---|---|
| Revenue | ₹34.3 Cr | ₹37.2 Cr | ₹51 Cr | ₹48.8 Cr |
| Net Profit | ₹3.2 Cr | ₹2.1 Cr | ₹3.5 Cr | ₹3.9 Cr |
| EPS | ₹0.46 | — | ₹0.52 | ₹0.56 |
| Operating Profit | ₹5.7 Cr | ₹3.8 Cr | ₹6.1 Cr | ₹6.3 Cr |
Peer Comparison
Trading - MetalsCorporate Information
Large Deals
View AllBulk, Block and Short deals reported for this stock.
Loading Deals...
Corporate Actions
Recent actions
| Ex Date | Purpose | Type |
|---|---|---|
| 20 Mar 2024 | Bonus 1:2 | BONUS |
| 23 Dec 2022 | BONUS 1:1 | BONUS |
| 22 Feb 2022 | BONUS 1:10 | BONUS |
Announcements
Latest updates
Board Meetings
Upcoming and past meetings
Corporate Events
Upcoming results & meetings
No upcoming events found
We couldn't find any scheduled corporate actions for this symbol at the moment.
Latest News
News for NRL
View All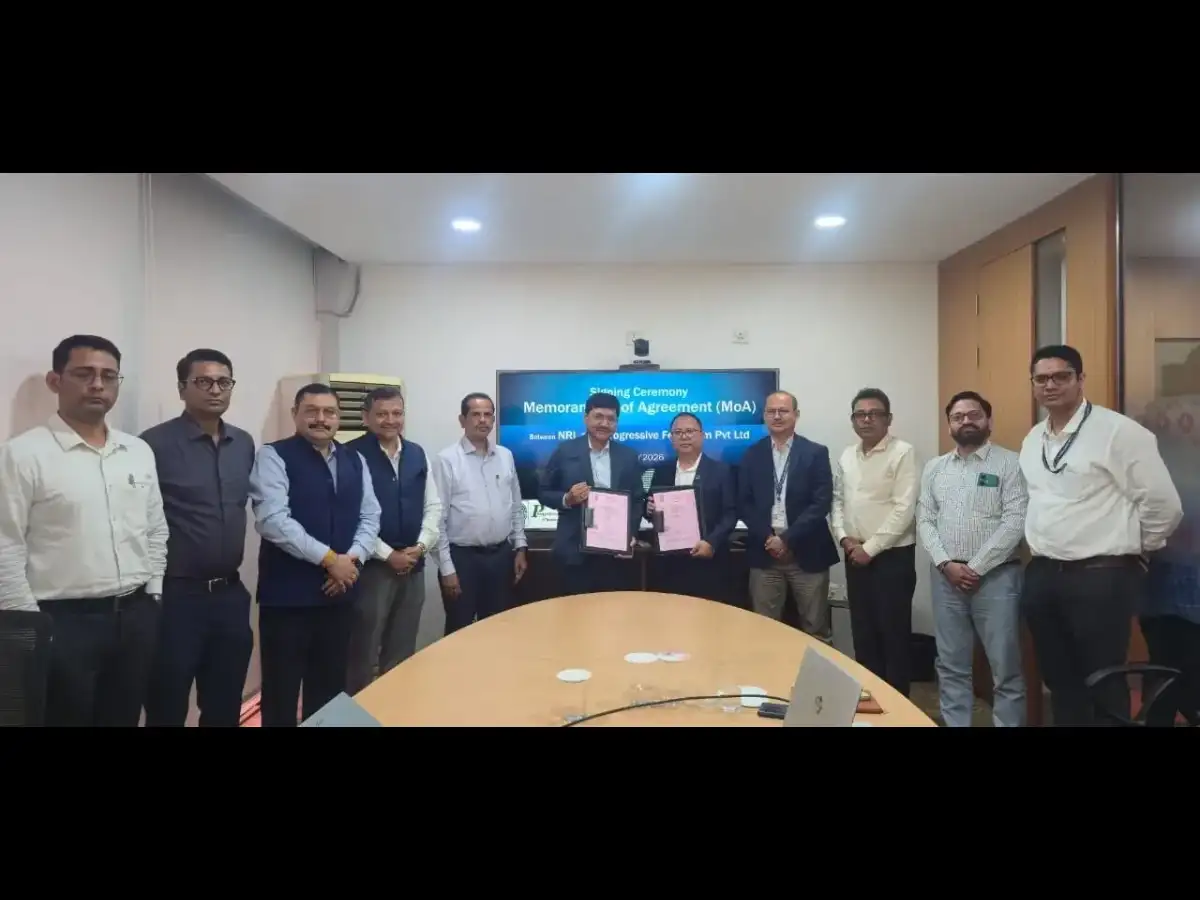
positive
ET Markets - Industry 25d ago
Numaligarh Refinery signs post-expansion agreement with Progressive Fertichem
Numaligarh Refinery Limited has secured a significant deal. The company will sell 52,500 Metric Tonnes of Sulphur annually to Progressive Fertichem Private Limited. This marks the first commercial agreement post the refinery's expansion project. The deal ensures a long-term off-take for the refinery's Sulphur production. This partnership is expected to boost NRL's revenue and signals readiness for its expanded capacity.
LTGILTBEESNRLTAKEFinancial ServicesHealthcare