EMULTIMQ
NSEPrice History
Investment Checklist
Technical Analysis
Technical Analysis
Analysis from 2026-07-10
Trend
Price below most MAs — downtrend
Price Action
Support & Resistance Levels
Volume Analysis
Recent MA Crossovers
Stop Loss Levels
Fixed Risk
Technical Levels
Moving Averages
Financials
Peer Comparison
Mutual Fund SchemePeer Comparison
Symbol | Name | Price | Change | P/E Ratio | Market Cap |
|---|---|---|---|---|---|
| SBI-ETF Nifty 50 | ₹260.02 | +0.82% | — | ₹2.06L Cr | |
| UTI Nifty 50 ETF | ₹267.58 | +0.87% | — | ₹66.50K Cr | |
| Nippon India ETF Nifty 50 BeES | ₹275.07 | +0.85% | — | ₹55.09K Cr | |
| NIPPON INDIA ETF GOLD BEES | ₹118.14 | -0.24% | — | ₹52.81K Cr | |
| UTI BSE Sensex ETF | ₹855.98 | +0.93% | — | ₹51.02K Cr | |
| ICICI Prudential Nifty 50 ETF | ₹273.72 | +0.93% | — | ₹36.15K Cr | |
| Nippon India Mutual Fund - Nippon India Silver ETF | ₹208.83 | -1.93% | — | ₹29.49K Cr | |
| ICICI Prudential BSE Sensex ETF | ₹889.52 | +0.90% | — | ₹25.31K Cr | |
| CPSE ETF | ₹96.22 | +0.68% | — | ₹25.14K Cr | |
| HDFC Mutual Fund-HDFC Gold Exchange Traded Fund | ₹122.08 | -0.15% | — | ₹20.87K Cr | |
| Edelweiss MF - Edelweiss Nifty500 Multicap Momentum Quality 50 ETF | ₹41.56 | +1.17% | — | ₹32 Cr |
Corporate Information
Latest News
News for EMULTIMQ
View All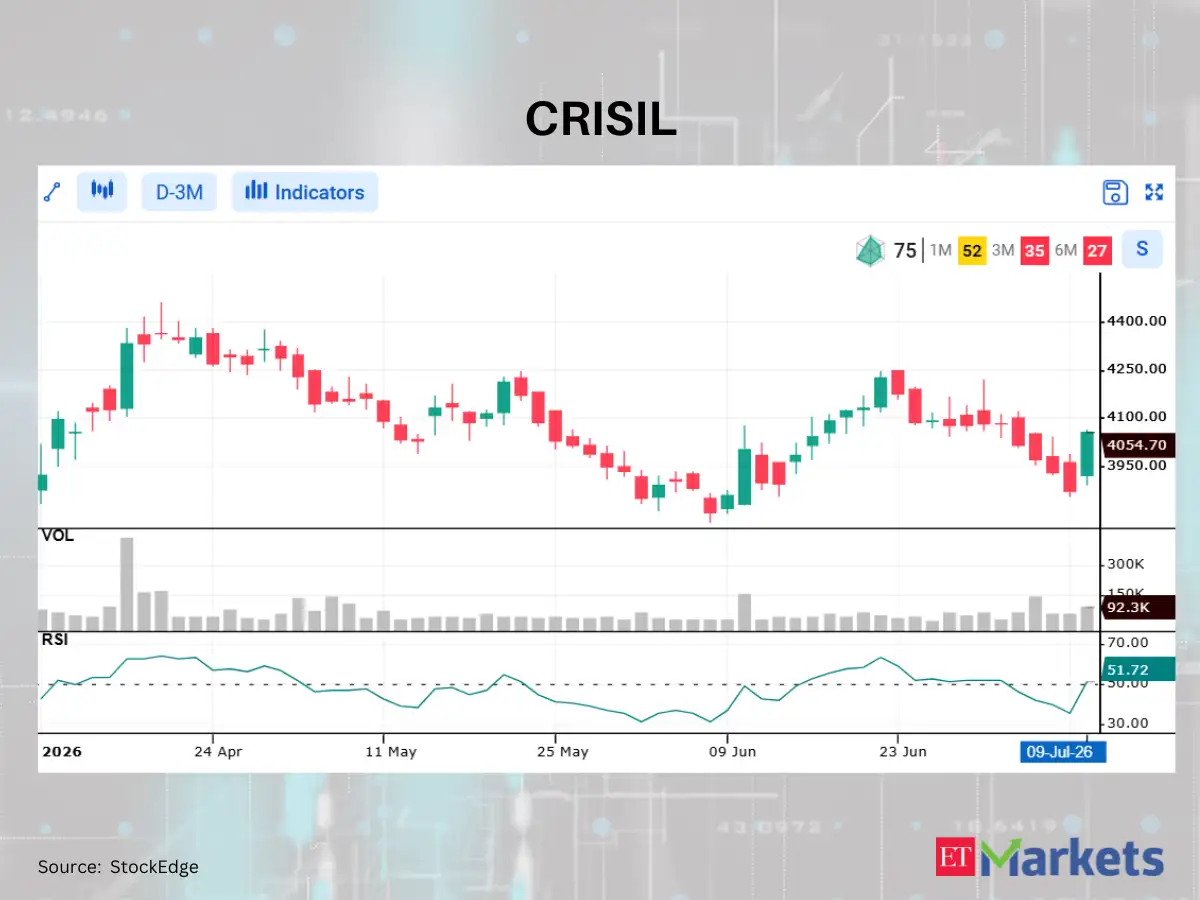
Kaynes Technology among 5 stocks showing bullish RSI upswing
Five stocks in the Nifty500 segment that gained over 5% featured in the RSI Trending Up scan on July 9 after showing improving momentum. The RSI moved above the 50 mark from lower levels, signalling strengthening price action, improving sentiment and potential short-term buying opportunities for traders tracking bullish technical setups.
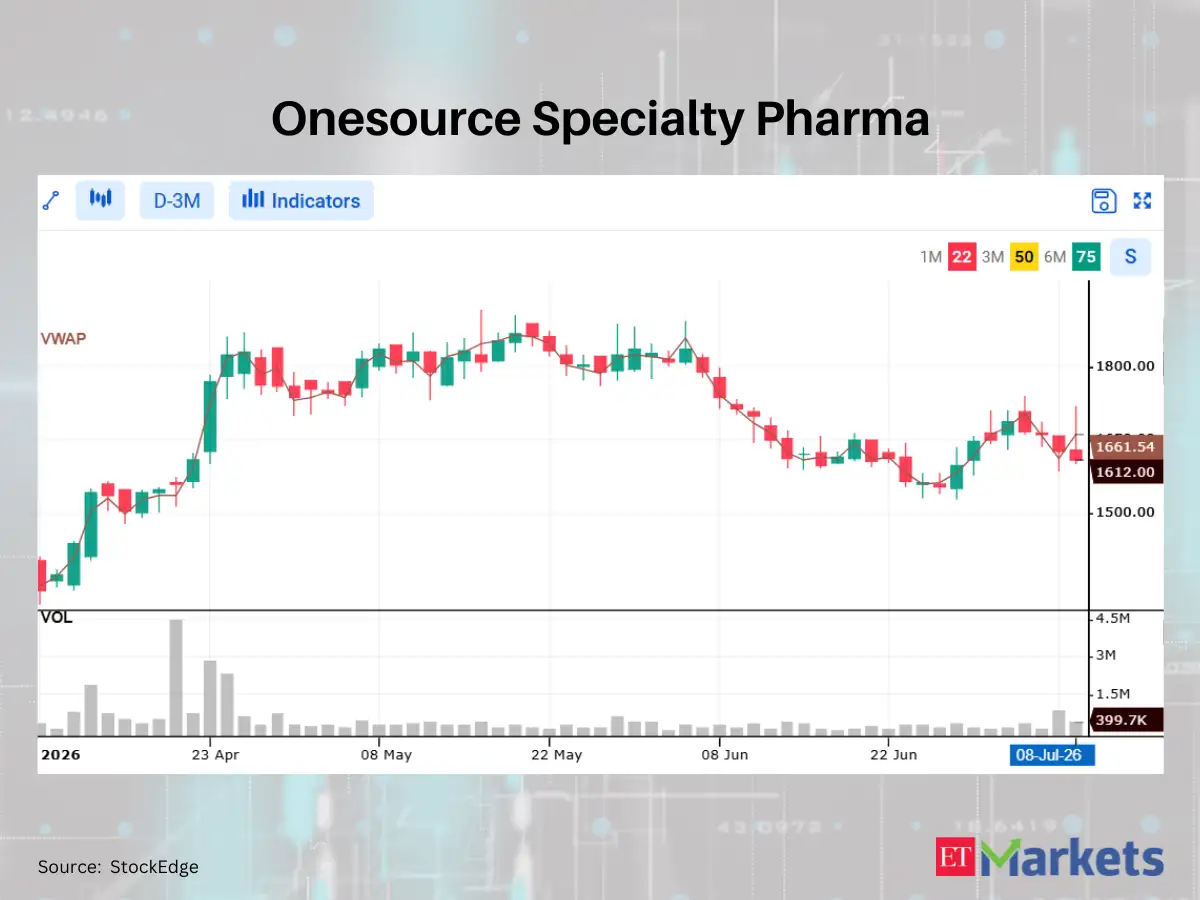
Aegis Logistics among 4 stocks that closed below VWAP
Four Nifty500 stocks, Balkrishna Industries, Aegis Logistics, PhysicsWallah and OneSource Specialty Pharma, closed over 3% below VWAP, highlighting bearish sentiment and weakening price momentum.
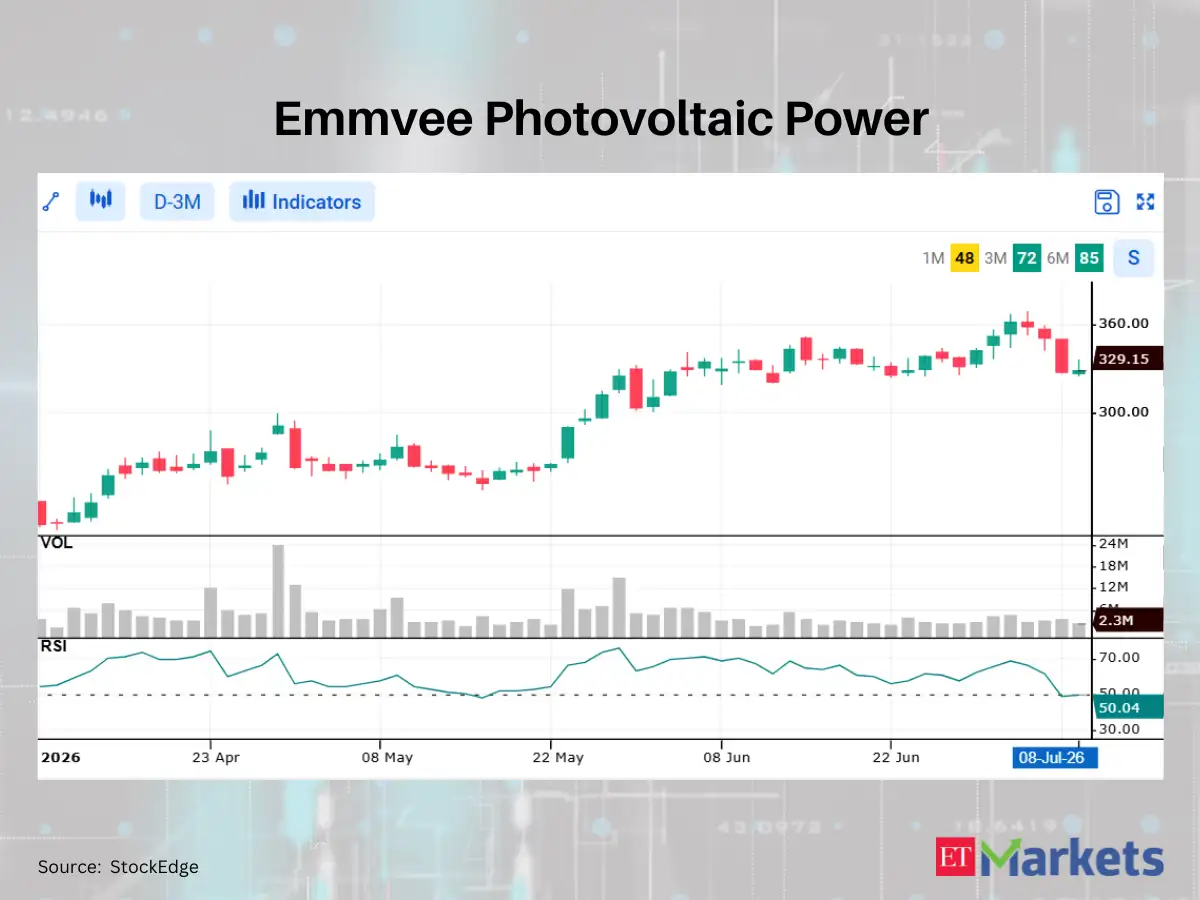
Premier Energies among 4 stocks showing bullish RSI upswing
Four stocks in the Nifty500 pack featured in the RSI Trending Up scan on July 8 after showing improving momentum. The RSI moved above the 50 mark from lower levels, signalling strengthening price action, improving sentiment and potential short-term buying opportunities for traders tracking bullish technical setups.